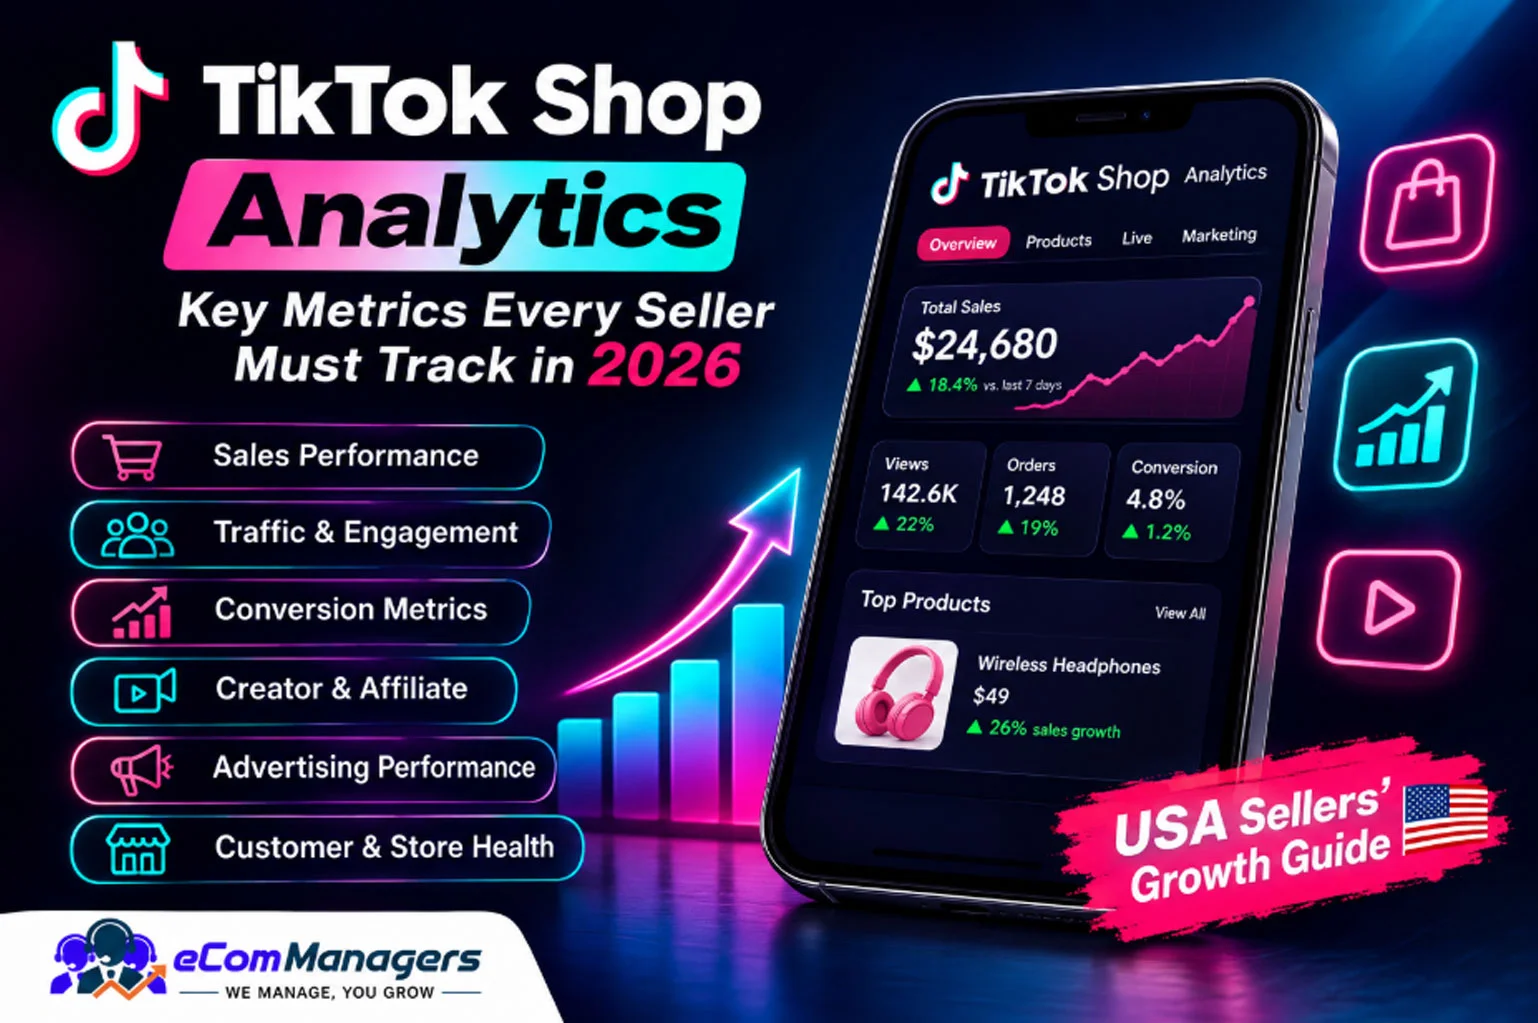
The Most Important TikTok Shop Analytics Metrics
Not every number deserves equal attention. The following metrics give sellers a practical framework for evaluating store performance.
1. Gross Merchandise Value (GMV)
GMV is one of the most visible ecommerce performance metrics on TikTok Shop.
It shows the total value of merchandise sold before certain deductions such as refunds, fees, commissions, and other costs.
GMV is useful for measuring sales momentum, but it should never be treated as the same thing as profit.
How to Use GMV Correctly
Compare GMV across:
- Daily periods
- Weekly periods
- Monthly periods
- Individual products
- Traffic sources
- Creator campaigns
- LIVE sessions
A rising GMV is encouraging, but always investigate what is happening underneath it.
2. Orders and Units Sold
Revenue alone can hide important changes in customer behavior.
For example, revenue may increase because you sold more units, raised prices, or generated more high-value orders.
Track orders and units sold alongside GMV to understand the actual volume behind your growth.
3. Average Order Value
Average Order Value, or AOV, tells you approximately how much customers spend per order.
A basic calculation is:
AOV = Total Sales ÷ Number of Orders
A rising AOV can indicate that customers are purchasing higher-priced products or multiple products in the same order.
A Simple AOV Improvement Test
Test:
- Product bundles
- Multi-pack offers
- Complementary products
- Limited-time discounts
- Cross-selling opportunities
What to Watch
Do not increase AOV at the expense of conversion rate. A higher order value is only useful if customers continue buying at a healthy rate.
TikTok Shop Traffic and Engagement Metrics
Sales metrics tell you what happened. Traffic metrics can help explain why it happened.
4. Product Views
Product views show how many shoppers reached your product page or product experience.
A high number of views with low sales can indicate a conversion problem.
Possible causes include:
- Weak product positioning
- Uncompetitive pricing
- Poor product images
- Limited reviews
- Unclear benefits
- Weak product descriptions
5. Product Click-Through Rate
Click-through behavior helps you understand whether your content is successfully moving shoppers from discovery toward the product.
If videos receive strong views but very few product clicks, the problem may be the content hook or product presentation rather than the product itself.
6. Conversion Rate
Conversion rate is one of the most important TikTok Shop analytics metrics because it connects shopper interest with actual purchases.
A simple formula is:
Conversion Rate = Orders ÷ Relevant Product Visits × 100
A low conversion rate does not automatically mean your product is bad.
It can indicate a mismatch between the audience, content promise, price, product page, or offer.
7. Traffic Source Performance
Do not combine all TikTok Shop traffic into one number.
Break performance down by sources such as:
- Shoppable videos
- LIVE shopping
- Product Showcase
- Creator or affiliate traffic
- Paid advertising
- Organic discovery
This makes it easier to identify where your best customers are coming from.
TikTok Shop Product Analytics
Your store can have strong overall sales while individual products perform very differently.
8. Product-Level Revenue
Track revenue for each SKU rather than looking only at total store sales.
This helps identify:
- Best sellers
- Products losing momentum
- Products worth promoting
- Products requiring better content
- Products that may need pricing changes
9. Product Conversion Rate
Compare product conversion rates rather than assuming your most-viewed product is your strongest product.
A product with fewer views but a much higher conversion rate may deserve additional traffic.
10. Refund and Return Rate
Sales are not the end of the customer journey.
Monitor refunds, returns, cancellations, and customer complaints by SKU.
A product with high GMV but an unusually high refund rate can be less valuable than a lower-volume product with stronger customer satisfaction.
TikTok Shop Creator and Affiliate Analytics
Creators can play a major role in TikTok Shop growth, which makes creator-level measurement essential.
Current analytics approaches increasingly recommend separating creator performance from simple GMV because revenue alone does not show whether the traffic was profitable.
11. Creator-Generated Sales
Track how much revenue and how many orders each creator generates.
Do not simply keep working with the creator who produces the most views.
Look for creators who produce qualified traffic and consistent conversions.
12. Creator Conversion Rate
Compare creators using:
- Clicks
- Product views
- Orders
- Conversion rate
- Revenue
- Commission
- Refunds
This helps identify creators who generate buyers instead of just attention.
13. Affiliate Commission and Profitability
A creator generating $10,000 in GMV is not necessarily more valuable than one generating $6,000.
You need to consider creator commission, product margin, refunds, discounts, and other selling costs.
Measure Contribution, Not Just Revenue
A better question is:
“How much profitable revenue did this creator generate?”
This prevents sellers from scaling partnerships that look impressive in GMV reports but produce weak margins.
TikTok Ads Analytics for Shop Sellers
TikTok Shop analytics should also connect with your paid advertising data.
Your existing TikTok Ads Management strategy can be strengthened when you connect campaign performance with actual store outcomes rather than judging ads only by clicks or impressions.
14. Advertising Spend
Track how much you spend by campaign, product, audience, and time period.
This gives you the foundation for measuring efficiency.
15. Cost Per Acquisition
CPA, or cost per acquisition, tells you approximately how much advertising spend is required to generate a desired customer action.
A rising CPA can indicate:
- Audience saturation
- Weak creative
- Poor conversion
- Higher competition
- Incorrect campaign structure
16. Return on Ad Spend
ROAS measures the revenue generated relative to advertising spend.
For example:
ROAS = Attributed Revenue ÷ Ad Spend
However, ROAS should not be your only profitability metric.
A campaign can show an attractive ROAS while still producing weak profit after product costs, platform fees, creator commissions, shipping, and refunds.
17. Cost Per Click and Engagement
Metrics such as CPC, impressions, clicks, and engagement help diagnose creative and targeting performance.
If impressions are strong but clicks are weak, your creativity may need improvement.
If clicks are strong but conversions are weak, investigate the product page, offer, price, or audience quality.
TikTok LIVE Analytics Metrics
LIVE shopping deserves its own measurement framework.
18. LIVE Viewers
Track total viewers as well as how long viewers stay.
Large viewer numbers are useful, but they do not automatically mean strong sales.
19. LIVE Engagement
Monitor:
- Comments
- Likes
- Shares
- Product clicks
- Questions
- Add-to-cart activity
- Orders
High engagement combined with weak sales can indicate that the host is entertaining viewers but not moving them toward purchase.
20. LIVE Sales and Conversion
Compare sales generated during different LIVE sessions.
Track which:
- Hosts
- Products
- Offers
- Time slots
- Demonstrations
- Scripts
produce the strongest results.
This turns live selling from an unpredictable activity into a repeatable process.
Customer and Store Health Metrics
Revenue metrics alone are not enough for sustainable growth.
21. Customer Reviews and Ratings
Monitor product ratings and review trends by SKU.
A sudden decline in ratings can eventually affect conversion and customer trust.
22. Cancellation and Refund Trends
Look for patterns rather than isolated incidents.
If cancellations or refunds increase after a particular campaign, creator promotion, or product change, investigate the connection.
23. Fulfillment Performance
Shipping and fulfillment can directly influence customer experience.
Track operational performance alongside marketing data so you can see whether growth is creating service problems.
TikTok Shop Analytics Tools and Data Sources
There is no single dashboard that necessarily answers every business question.
TikTok Shop Analytics Tool Options
Your analytics stack may include:
- TikTok Shop Seller Center
- TikTok Ads Manager
- LIVE analytics
- Spreadsheet reporting
- Ecommerce accounting tools
- Third-party TikTok Shop analytics tools
- Profit and business intelligence platforms
External platforms can combine TikTok Shop data with advertising, product, creator, and profitability information. Current analytics solutions increasingly focus on moving beyond GMV toward verified profit and contribution analysis.
When Should You Use a Third-Party Tool?
A TikTok Shop analytics tool becomes more valuable when:
- You manage many SKUs
- Multiple creators drive sales
- Advertising spend is significant
- You sell across multiple channels
- Manual reporting takes too much time
- You need profit-level reporting
What About the TikTok Shop Analytics API?
For larger businesses, the TikTok Shop analytics API can be useful when data needs to be connected with internal reporting systems, dashboards, or other business applications.
API-based workflows can reduce manual exports and make it easier to combine TikTok Shop analytics data with advertising, inventory, financial, and customer information.
Do Not Automate Bad Data
Automation does not automatically create better decisions.
Before building an automated reporting system, define exactly which metrics you need, how they are calculated, and which business decisions they support.
How to Build a TikTok Shop Analytics Dashboard
A useful dashboard should answer business questions quickly.
Daily Dashboard
Track:
- Orders
- Revenue
- Product views
- Conversion rate
- Ad spend
- Major traffic sources
- Refunds or cancellations
Weekly Dashboard
Add:
- Product performance
- Creator performance
- Campaign performance
- AOV
- CPA
- ROAS
- Content performance
Monthly Dashboard
Review:
- Revenue growth
- Profitability
- Best-selling products
- Creator contribution
- Customer trends
- Advertising efficiency
- Refund trends
- Inventory implications
How to Turn TikTok Shop Analytics Into Action
Analytics only become valuable when they change what you do next.
If Traffic Is High but Conversion Is Low
Review:
- Product price
- Listing quality
- Product reviews
- Offer structure
- Product-market fit
- Audience quality
If Conversion Is High but Traffic Is Low
You may have a strong product that simply needs more qualified exposure.
Consider:
- More creator partnerships
- New video concepts
- Paid traffic
- LIVE selling
- Better product discovery content
If Sales Are High but Profit Is Low
Review:
- Product costs
- Advertising spend
- Creator commissions
- Discounts
- Shipping costs
- Refunds
- Platform fees
Do not scale revenue blindly when contribution margin is weak.
A Practical TikTok Shop Analytics Routine for 2026
For most U.S. sellers, analytics does not need to become an all-day task.
Daily
Check sales, orders, advertising spend, major product changes, and unusual performance shifts.
Weekly
Compare products, creators, content, traffic sources, conversion rates, and advertising efficiency.
Monthly
Review profitability, customer trends, product portfolio performance, and growth opportunities.